
| Area | South Fork Battle |
| Topic | Temperature: Min, Ave, Max Above South PH, 1997 |
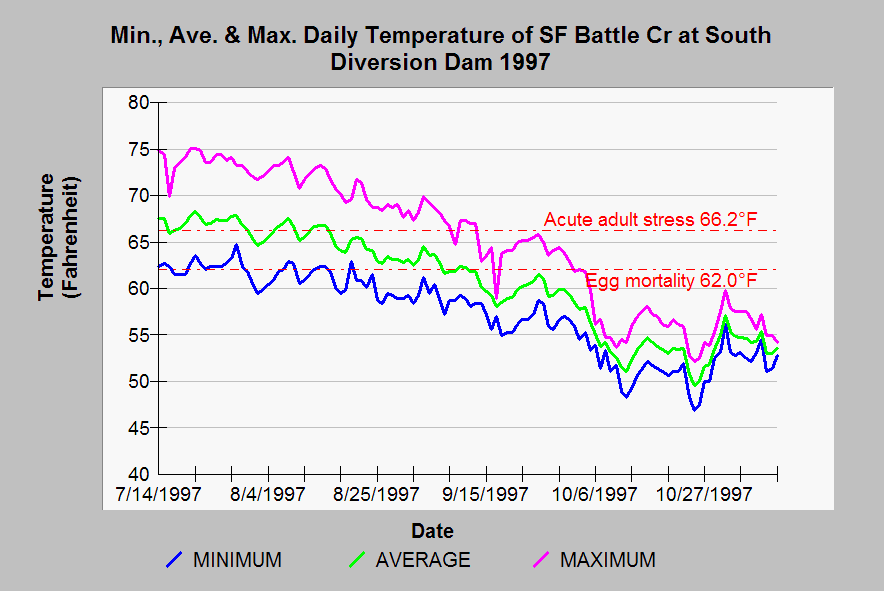
| Caption: This temperature graph shows minimum, maximum, and average water temperatures of South Fork Battle Creek upstream of South Powerhouse in 1997. Thresholds shown on the graph above are for the egg life history stage before July 1 for winter chinook, spring chinook eggs after September 15 and for holding spring chinook adults during summer (July-September). Average daily water temperatures show conditions that would have been highly stressful for adult spring chinook (>66 F) and also for spring chinook eggs in late September (>62 F). This reach is at higher elevation and is projected to have substantially improved temperature conditions for winter run and spring chinook if flows are increased. Click on Picture to see projected habitat quality associated with restoration. See Info Links for more information on temperature thresholds. | |
 |
To learn more about this topic click Info Links .
To view additional information (data source, aquisition date etc.) about this page, click Metadata .
To view the table with the chart's data, click Chart Table web page.
To download the table with the chart's data, click sf5mma97.dbf (size 14,238 bytes)
To download the table with the chart's data as an Excel spreadsheet, click sf5mma97.dbf.xls (size 12,608 bytes) .
| www.krisweb.com |