
| Area | South Fork Battle |
| Topic | Temperature: Min, Ave, Max Below Coleman Div Dam, 1998 |
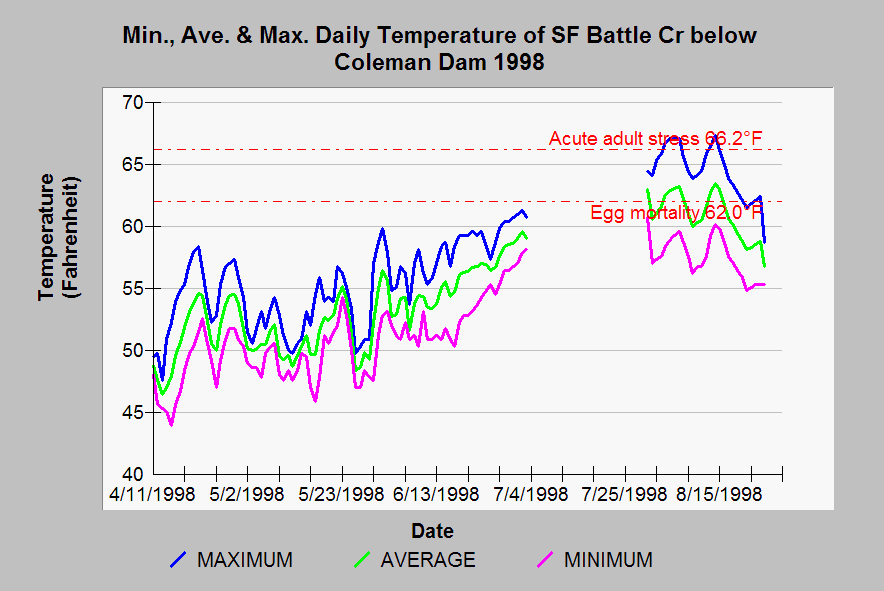
| Caption: This temperature graph shows minimum, maximum, and average water temperatures of the South Fork Battle Creek below Coleman Diversion Dam in 1998. See Info Links for more information on temperature thresholds. There is no data for the period 7/3/98 to 7/30/98. | |
 |
To learn more about this topic click Info Links .
To view additional information (data source, aquisition date etc.) about this page, click Metadata .
To view the table with the chart's data, click Chart Table web page.
To download the table with the chart's data, click cdmma98.dbf (size 9,615 bytes)
To download the table with the chart's data as an Excel spreadsheet, click cdmma98.dbf.xls (size 11,636 bytes) .
| www.krisweb.com |