
| Area | South Fork Battle |
| Topic | Climate: Rainfall - Mineral RS - Maximum 24 hr. Period 1928-2000 |
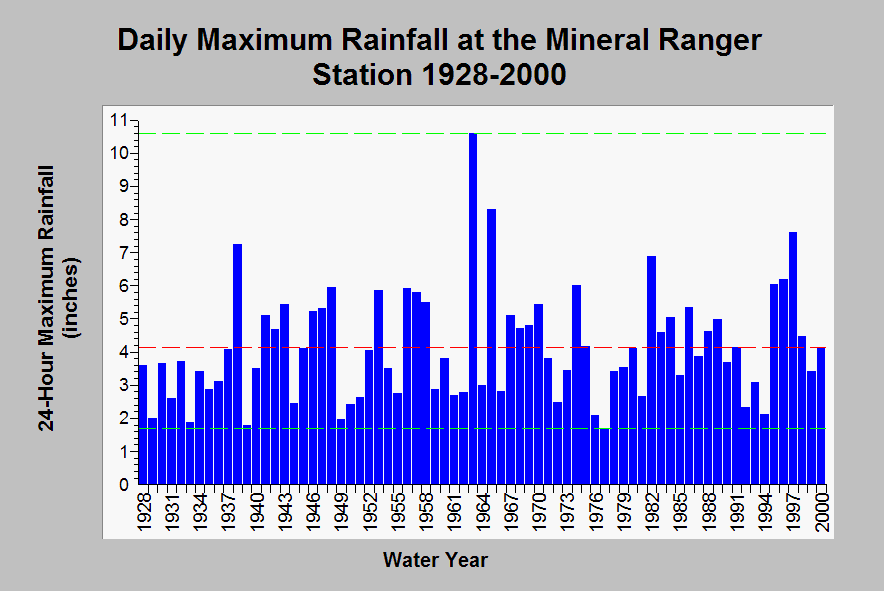
| Caption: This chart shows daily maximum rainfall accumulation recorded at the Mineral Ranger Station rain gage (DWR # A40 5679 00) between 1928 and 2000. For the period of record, the maximum annual 24-hour rainfall accumulation ranged between 1.70 inches in 1977 to 10.60 inches in 1963. The dashed green lines are maxima and minima and the red line is the median of all maximum daily values. The January 1997 storm had the third highest 24 hour maximum with 7.61 inches. Data are compiled by the California Department of Water Resources. See Info Links for more information. | |
 |
To learn more about this topic click Info Links .
To view additional information (data source, aquisition date etc.) about this page, click Metadata .
To view the table with the chart's data, click Chart Table web page.
To download the table with the chart's data, click climate_rainfall_annual_stats_mineral.dbf (size 2,174 bytes)
To download the table with the chart's data as an Excel spreadsheet, click climate_rainfall_annual_stats_mineral.dbf.xls (size 10,752 bytes) .
| www.krisweb.com |