
| Area | South Fork Battle |
| Topic | Temperature: Average at 5 South Fork Sites, 2001 |
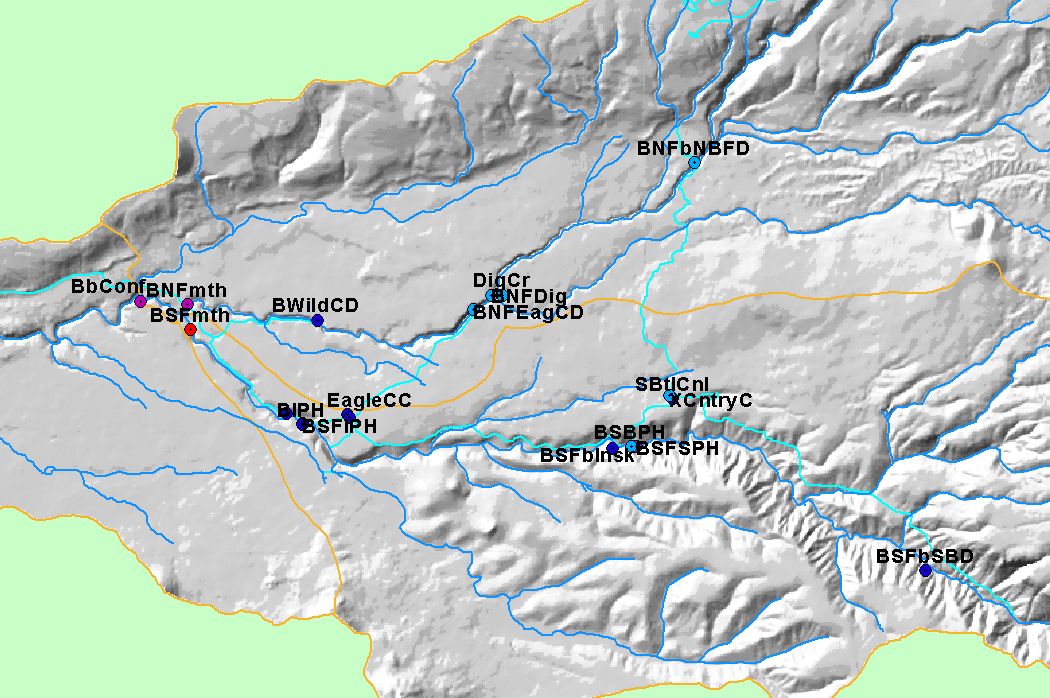
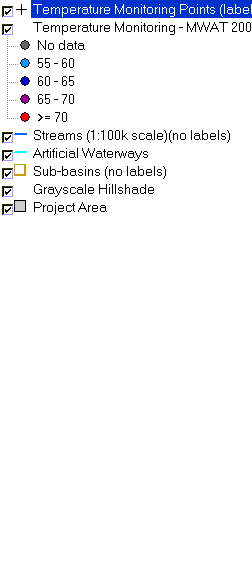
| This map shows locations of temperature monitoring stations in the North and South Fork of Battle Creek and their tributaries, overlayed on top of USGS 100,000 scale streams (including canals), KRIS sub-basins, and a grayscale hillshade. Sites are color-coded by their maximum floating weekly average temperature (MWAT) for the year 2001. Data were contributed by the California Department of Water Resources. Scale = 1:104,068 . | |||
 |
 |
||
To view metadata about a map layer, click on a link in the table below.
| Name of Layer in Map Legend | Metadata File Name |
|---|---|
| Temperature Monitoring Points (labels) | battle_temps.shp.txt |
| Temperature Monitoring - MWAT 2001 | battle_temps.shp.txt |
| Streams (1:100k scale)(no labels) | stms100.shp.txt |
| Artificial Waterways | canals.shp.txt |
| Sub-basins (no labels) | subbasins.shp.txt |
| Grayscale Hillshade | grayscale_light.tif.txt |
| Project Area | battl_outl.shp.txt |
| www.krisweb.com |