| Area | Basin-wide/General |
| Topic | Fish: 1998-1999 Garcia Trib Spawning, Redds/Reach Mile |
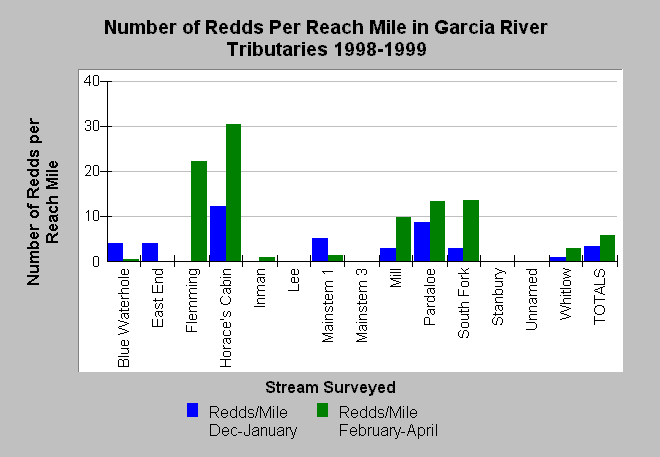
| Caption: This chart shows the number of redds observed per mile in spawner surveys of 14 Garcia River tributaries from December 1998 to March 1999. The stacked bars differentiate early season (December-January) versus late season spawning (February-March). The highest number of redds per mile was in Horace's Cabin Creek followed by Fleming Creek (SF), Pardaloe Creek, South Fork Garcia River and Mill Creek. Data are from Maahs (1999). See InfoLinks for more information. | |
 |
To learn more about this topic click Info Links .
To view additional information (data source, aquisition date etc.) about this page, click Metadata .
To view the table with the chart's data, click Chart Table web page.
To download the table with the chart's data, click fish_spawn_gar_maahs_98_99.db (size 18,432 bytes) .
To view the table with the chart's source data, click Source Table web page.
To download the table with the chart's source data, click fish_spawn_gar_maahs_89_99_source.db (size 18,432 bytes)
| www.krisweb.com |
