Bibliography Background About KRIS
Hypothesis #3: Continuing sediment contributions to the Gualala River and its tributaries from recent land use (1985-2001) are preventing recovery of coho salmon and steelhead habitat.
Support for the Hypothesis
Dietrich et al. (1989) found that increased sediment supply increases the proportion of fine sediment on the surface of a streambed in a riffle, which in turn leads to a reduction in median particle size distribution. The median particle size distribution in the Gualala River has been measured for many different locations by Gualala Redwoods, Inc. (GRI) and Coastal Forest Lands (1997 as cited in CRWQCB, 2001). Knopp (1993) found that watersheds heavily disturbed by logging had very small median particle size distribution (D50). All Gualala River locations measured, with the exception of Dry Creek, have median particle sizes which indicate highly disturbed watershed conditions (CRWQCB, 2001). The D50 for the Gualala basin is shown in Figures 1-5. This metric can be affected by gradient, channel confinement and stream power; therefore, it is not the optimal statistic for tracking trends in aquatic habitat. However, the consistent small particle size across all locations, including higher order streams with more stream power, is indicative of active sediment supply in all locations. These small particles are highly mobile and the median particle size distribution would increase, if sediment supply were not active.
 Figure 1. This chart shows the median particle size distribution of the streambed at several locations in the North Fork Gualala River basin between 1997 and 2001. The values in the mainstem North Fork (NF) are most telling because it is a Fifth Order stream, and yet median particle size distribution is small. The reference line is from CRWQCB (2001) to delineate aquatic conditions known to be associated with high watershed disturbance (Knopp, 1993).
 Figure 2. The chart at left shows the median particle size distribution of the streambed at several locations in lower Rockpile Creek. All values except the 1999 measurement at RP #221 CS3 are under the suggested TMDL range of 37 mm, which was supposed to be applied to 3rd order streams. Rockpile Creek is a 4th order stream, which should have larger particle sizes naturally as a result of higher stream power.
 Figure 3. The median particle size distribution of the streambed at several locations in Buckeye Creek. All values except the 2000 measurement at BC#223 CS2 is under the suggested TMDL range of 37 mm. Buckeye Creek is a 4th order stream, while the target was meant for 3rd orders streams.
 Figure 4. The median particle size distribution of the streambed at several locations in Wheatfield basin in 1997 and 2000 is at left. All values except the 2000 measurement at WF#226 CS1 are under the suggested TMDL range of 37 mm, despite the high stream power of this Fifth Order stream.
 Figure 5. The chart at left shows the median particle size distribution of the streambed at several locations in the lower South Fork and mainstem Gualala River. All values, except two for Big Pepperwood Creek (PW), are under the suggested TMDL range of 37 mm.
Higgins (2001) showed that pool volume decreased in Freshwater Creek (Humboldt County) in response to logging and road building similar to land use activity in the North Fork Gualala River basin. Pools in upper Freshwater Creek were 19% and 15% filled with sediment in 1992 and 1993, respectively, but were 46% filled in 1999 after approximately 40% of the upper basin had been logged (Higgins, 2001). In 1994, Entrix, Inc surveyed the North Fork Gualala basin (Entrix 1995a, 1995b, 1995c), and in 2001, the California Department of Fish and Game surveyed the same reaches. (Figure 6). The survey reaches were on Doty Creek, Little North Fork Gualala and the mainstem North Fork Gualala River. While most habitat typing survey data are not able to be compared over time because of the potential effect of observer bias (Roper and Scarnecchia, 1995), maximum pool depths are a repeatable, physical measurement.
 Figure 6. This chart shows a comparison of results of 1994 and 2001 habitat typing surveys in the North Fork Gualala River, Little North Fork and Doty Creek. The proportion of pools in Doty Creek greater than two feet deep increased between 1994 and 2001, while the proportion of deeper pools decreased in both the Little North Fork and North Fork Gualala. The North Fork shows the most significant change in terms of loss of fish habitat, with 22 fewer pools deeper than four feet and six fewer pools between 3-4 feet. This high rate of pool filling suggests high sediment supply between 1994 and 2001.
Barnard (1992) found that fine sediment (<1 mm) averaged 13% in gravels outside redds in Freshwater Creek after fifty years of watershed rest from logging. Higgins (2001) used Pacific Lumber Company's recent bulk gravel sample data to show that fine sediment doubled or tripled at all stations measured by Barnard (1992) after widespread logging and road building. Fines in Freshwater Creek increased in years with high intensity rainfall events, such as 1997, but tended to decrease in years with high sustained flows, such as 1998 and 1999 (Higgins, 2001). Gualala Redwoods, Inc measured fine sediment less than 0.85 mm at various North Fork locations from 1992 to 1997. The results (Figure 7) show major fluctuations indicative of active supply.
 Figure 7. The chart at left shows fine sediment (<0.85 mm) for various North Fork Gualala locations. Fine sediment fluctuated from 12% to 28% at one Little North Fork location (lnf 255), and showed major changes in McGann Creek and Robinson Creek. If sediment supply were not high, fine sediment levels would not show this degree of fluctuation. Without new supply this metric would be trending downwards.
When large amounts of sediment fill valley bottoms, streamside trees may be buried so deep they do not survive (Grant, 1988) and related changes in the water table may also cause mortality (Madej, 1975). Even willows and alders have difficulty colonizing stream side zones in highly aggraded, large order streams because of gravel instability (Lisle 1981). Naiman et al. (1992) point out that “Aggradation due to mass wasting or episodic debris flows can increase the flood stage and duration for mid-order streams.”
The flood plain of the Little North Fork Gualala River has experienced more frequent flooding as a result of aggradation and trees in the immediate riparian zone are dying because of increased water table height (Hope, 2001). Old growth stumps show that viable redwood habitat existed on the flood terraces of the Little North Fork from 500 to 1,000 years ago. Stumps of trees 50-80 years of age show that habitat was viable after the 1964 flood. Today aggradation has made survival of streamside redwoods impossible (Hope, 2001). Streamside alders 15 to 25 years old are also dying because they have been buried within the last five years (Figure 8). This is indicative of recent aggradation and active sediment supply from upland areas.
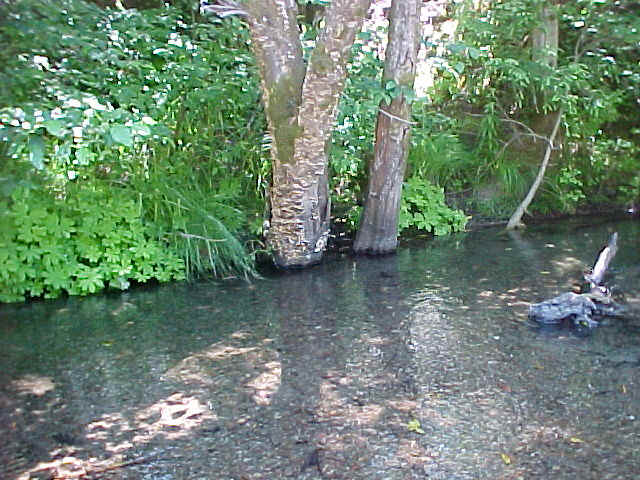 Figure 8. The alder in the center of this photo is at least fifteen years old and was recently killed by aggradation of the Little North Fork Gualala River. Alders cannot survive when the water table rises higher than the base of the tree. This is clear evidence that aggradation has taken place in the last few years and that sediment contributions and transport in the basin are active. Photo provided by Dave Hope, NCRWQCB.
Neither the TMDL (CRWQCB, 2001) nor the Gualala River Watershed Synthesis Report (CRA, In review) specifically discuss sediment supply from recent logging activity. An analysis of aerial photographs of the Noyo River basin indicated that landslides coincide with predicted chronic risk areas including steep slopes, inner gorges and headwall swales (Dietrich et al. 1998). Many areas of high landslide risk in the Gualala basin have been disturbed by clear cuts or road building. Aerial photos of recent clear cuts in the Gualala River basin show active supply from shallow debris torrents (Figure 9). Ground photos of ephemeral streams shortly after logging also show active soil loss and sediment contributions (Figure 10).
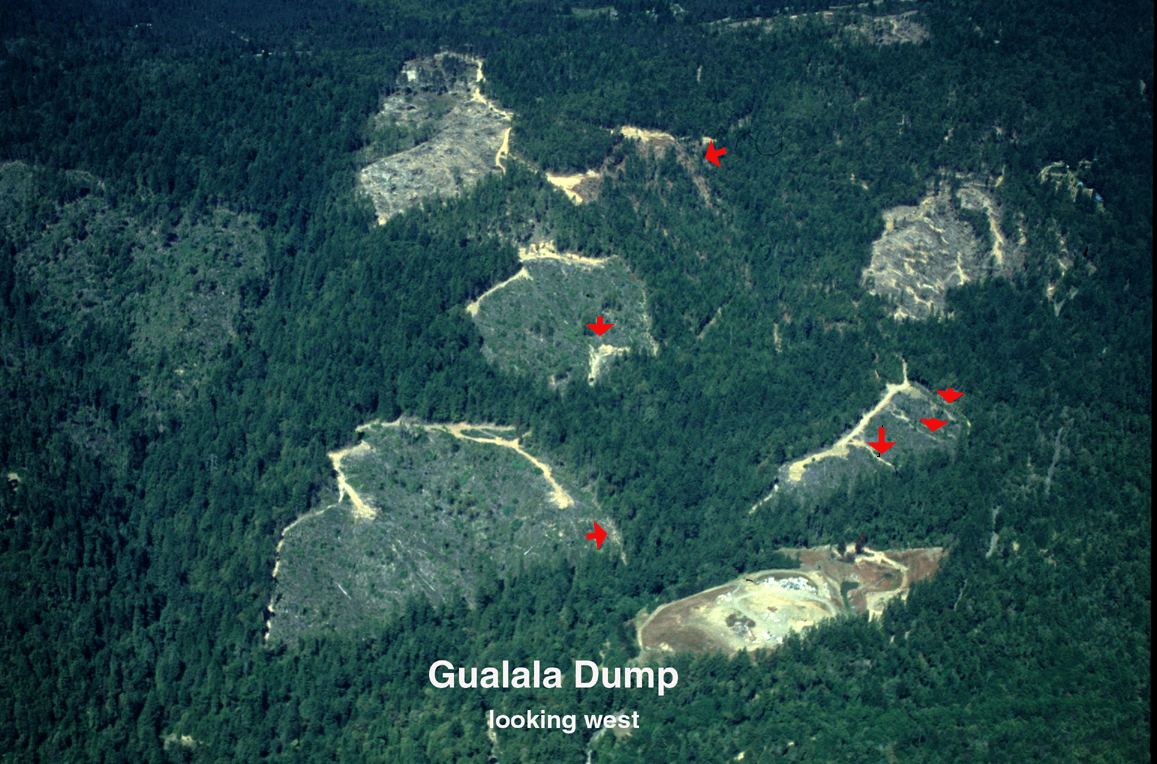 Figure 9. Clear cuts in unstable, inner gorge locations of upper Little North Fork Gualala River in 1999. Landslides, some with delivery to streams, are highlighted with arrows. The California Department of Water Resources noted that there were several storms in recent years with the potential to unleash and transport sediment (CRA, 2001), including January 1995, March 1995 and January 1997.
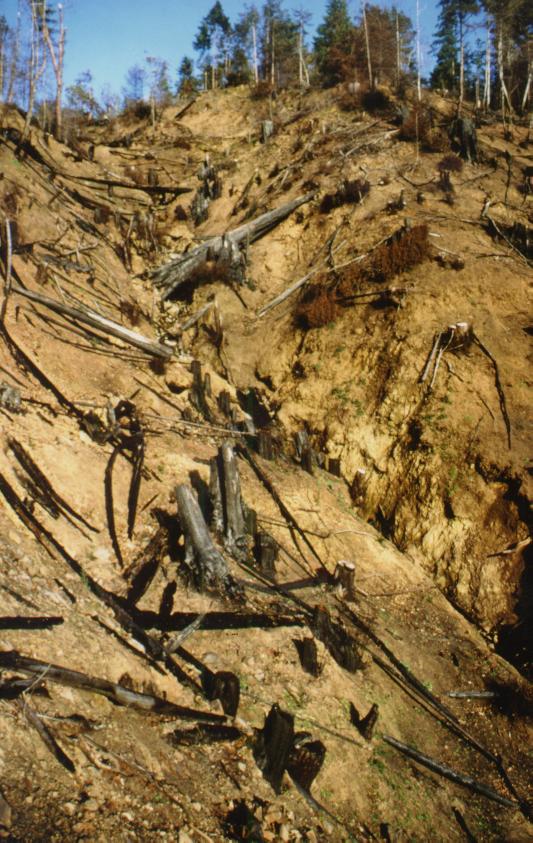 Figure 10. This is an ephemeral (Class III) tributary of Buckeye Creek after a recent timber harvest and site preparation. While timber harvest in Class III streams does not directly effect water temperatures, because of lack of surface flow in summer, removal of vegetation does cause sediment contributions to streams. Site preparation seems to have reduced ground cover at this site and recent soil loss is obvious.
The charts and pictures above, from the KRIS Gualala database, are derived from the KRIS topics listed here. Viewing this information in the KRIS database gives access to Info Links, Metadata and associated bibliographic resources. The large case letters in parentheses are sub-basins.
(NF) Sediment: D50 Values for North Fork Gualala Basin
(RC) Sediment: D50 Values for Rockpile Creek Basin
(BC) Sediment: D50 Values for Buckeye Creek Basin
(WF) Sediment: D50 Values for Wheatfield Fork Basin 1997-2000
(SF) Sediment: D50 Values for Gualala Main and South Fork Basin
(NF) Habitat: Max Pool Depths NF Gualala Survey Comparison 1994 vs 2001
(NF) Sediment: Percent Substrate <0.85 mm Values for NF Gualala Sites
(NF) Tour: NF Gualala Photos of Little NF (and NF) Channel 2001
(NF) Tour: Aerial and Ground Photos of NF Gualala Timber Harvest 2001
(BC) Tour: Aerial and Ground Photos of Timber Harvest Buckeye Cr
Alternative Hypotheses
Sediment supply is mostly from legacy of natural erosion and post-WW II disturbance and recent contributions are minor.
Logging and road building caused catastrophic sediment yield during the 1955 and 1964 flood events (California Resources Agency, In review). The California Geologic Service (Sterling, 2002a) supports this alternative hypothesis in their comments on KRIS Gualala: "While watershed disturbances from timber harvest practices undoubtedly result in increased sediment delivery to streams, other potentially significant natural causes should be discussed as well. Lack of attention to natural causes does not provide for adequate representation of naturally occurring mass wasting phenomena and sediment derived from them." In additional comments, Sterling (2002b) states that: "The NCWAP team has determined that natural sediment sources are the largest contributor in the Gualala River watershed." Support for this alternative hypothesis comes from CGS maps that show 40% of the landscape covered by active or dormant earthflows (Sterling, 2002b). The key question is how much material is delivered to streams from the toes of these features, a point on which CGS and North Coast Regional Water Quality Control Board (2001) disagree.
O'Connor (2002) favors this alternative hypothesis, and his review of KRIS Gualala stated: "In particular, claims by IFR that sediment size characteristics present in portions of the Gualala where data are available are attributable to logging that has occurred since the mid-1980’s ignores watershed geologic conditions and historic management of the Gualala River. Large swaths of terrain are mantled by deep rockslide and earthflow materials mapped by California Geological Survey (CGS) in the NCWAP report. These geologic materials are very likely to be significant long-term, natural sources of relatively fine-grained sediments. In addition, the NCWAP report documents extensive and locally severe watershed disturbance by logging in the 1950’s and 1960’s that are of a magnitude that greatly exceed more recent logging disturbance. Sediment generated by these disturbances, particularly the gravel fraction of the bed load material in the Gualala, would be routed through the river channel network over a period of decades to centuries. Consequently, sediment characteristics in the lower portions of major tributaries c. 2000 in the Gualala where data are available cannot be attributed to recent management influences in isolation."
Stream gradient and stream order are driving particle size distribution.
The South Fork and North Fork Gualala River follow the San Andreas Fault and earthquakes may sometimes change the grade of streams locally (Higgins, 1997). These areas would naturally have smaller particle size distribution (California Resources Agency, In review). In many areas, during high flows, tributaries back up and drop sediment at their mouths. This backwater effect was noted in several of the main tributaries and has formed a sediment mound in the active channel (CA RA, In review). O'Connor (2002b) advanced similar views that the very low gradient (<1%) of Gualala reaches measured by GRI would keep median particle size (D50) low regardless of sediment supply: "It is possible, if not likely, that sediment sizes in the lower gradient reaches of the Gualala where most of the data currently available have been collected are controlled to a large extent by declining stream gradient." Henry Alden of Gualala Redwoods, Inc. has suggested that median particle sizes in GRI streams are not far from those in less disturbed watersheds (see note) and, thus, within the range of natural variability.
Methods to Support or Refute the Hypotheses
A research method to evaluate this hypothesis would be to continue monitoring after logging has ceased and the watershed has had ten to fifteen years of rest. Methods used could include McNeil samples to measure fine sediment, V* to measure pool volume and D50 to monitor changes in median particle size distribution.. O'Connor's (2002a) hypothesis of gradient as the primary driver of D50 could be tested using samples upstream of current stations.
References
California Resources Agency. In press. Gualala River Watershed Synthesis Report. CA Dept. of Fish and Game, State Water Res. Control Bd., CA Dept. of Water Resources, CA Div. on Mines and Geology and CA Dept. of Forestry. Sacramento, CA. Draft released January 16, 2001.
California Regional Water Quality Control Board (CRWQCB). 2001. Technical Support Document for the Gualala River Watershed Water Quality Attainment Action Plan for Sediment. CRWQCB, Region 1. Santa Rosa, CA. 147 pp.
Dietrich,W. E., J.W. Kirchner, H. Ikeda, and F.Iseya. 1989. Sediment supply and the development of the coarse surface layer in gravel-bedded rivers. Nature. Vol. 340: 215-217.
Dietrich, W. E., ,R. Real de Asua, J. Coyle, B. Orr and M. Trso, 1998. A validation study of the shallow slope stability model, SHALSTAB, in forested lands of Northern California. Prepared for Louisiana-Pacific Corporation, Calpella, CA, 29 June.
Entrix, Inc. 1995a. Stream Inventory Report Doty Creek. Performed under contract to Gualala Redwoods, Inc. Entrix, Inc., Walnut Creek, CA. 34 p.
Entrix, Inc. 1995b. Stream Inventory Report Little North Fork Gualala River. Performed under contract to Gualala Redwoods, Inc. Entrix, Inc., Walnut Creek, CA. 41 p.
Entrix, Inc. 1995c. Stream Inventory Report North Fork Gualala River. Performed under contract to Gualala Redwoods, Inc. Entrix, Inc., Walnut Creek, CA. 43 p.
Grant, G. 1988. The RAPID technique: a new method for evaluating downstream effects of forest practices on riparian zones. Gen. Tech. Rep.PNW-GTR-220. Portland, OR. USDA Forest Service, Pacific Northwest Research Station. 36 pp.
Higgins, P.T. 1997. Gualala River Watershed Literature Search and Assimilation. Funded by the Coastal Conservancy under contract to Redwood Coast Land Conservancy. Gualala, CA. 59 pp.
Higgins, P.T. 2001. Freshwater Creek Watershed Analysis Dissenting Report: Fisheries Module. Arcata, CA. 95 pp. (2Mb PDF)
Hope, D. 2001. Little North Fork Pre-Harvest Inspection. North Coast Regional Water Quality Control Board, Santa Rose, CA. 24 p.
Knopp, C. 1993. Testing Indices of Cold Water Fish Habitat. Final Report for Development of Techniques for Measuring Beneficial Use Protection and Inclusion into the North Coast Region's Basin Plan by Amendment of the.....Activities, September 18, 1990. North Coast Regional Water Quality Control Board in cooperation with California Department of Forestry. 57 pp.
Lisle, T.E. 1981. The recovery of stream channels in north coastal California from recent large floods. In: K. Hashagen (ed.) Habitat Disturbance and Recovery Proceedings. Cal Trout, San Francisco, CA. pp 3 1-41.
Madej, M. A. 1975. Response of a stream channel to an increase in sediment load. Master’s thesis, University of Washington, Seattle, Washington.
Naiman, R.J., T.J. Beechie, L.E. Benda, D.R. Berg, P.A. Bisson, L.H. MacDonald, M.D. O'Connor, P.L. Olson, and E.A. Steel. 1992. Fundamental elements of ecologically healthy watersheds in the Pacific Northwest coastal ecoregion. Pages 127-188 in R.J. Naiman (ed.), Watershed Management: Balancing Sustainability and Environmental Change. Springer-Verlag, New York.
North Coast Regional Water Quality Control Board. 2002. Comments on KRIS Gualala. Memo to Institute for Fisheries Resources dated September 15, 2002. NCRWQCB, Santa Rosa, CA. 1 p.
O'Connor. M. 2002a. Comments on North Coast Watershed Assessment Program Draft (NCWAP) Report for Gualala River-Sediment d50 as an Indicator of Water Quality. Prepared for Gualala River Watershed Council, Gualala, CA, by O'Connor Environmental, Inc. Healdsburg, CA. Memo dated March 12, 2002. 9 p.
O'Connor, M. 2002b. Review of KRIS-Gualala. Memo to the Gualala Watershed Council dated July 9, 2002. Prepared for Gualala River Watershed Council, Gualala, CA. by O'Connor Environmental, Inc. Healdsburg, CA. 4p.
Roper, B. B. and D.L. Scarnecchia. 1995. Observer variability in classifying habitat types in stream surveys. North American Journal of Fisheries Management. 15: 49-53.