| Area | Basin-wide/Regional |
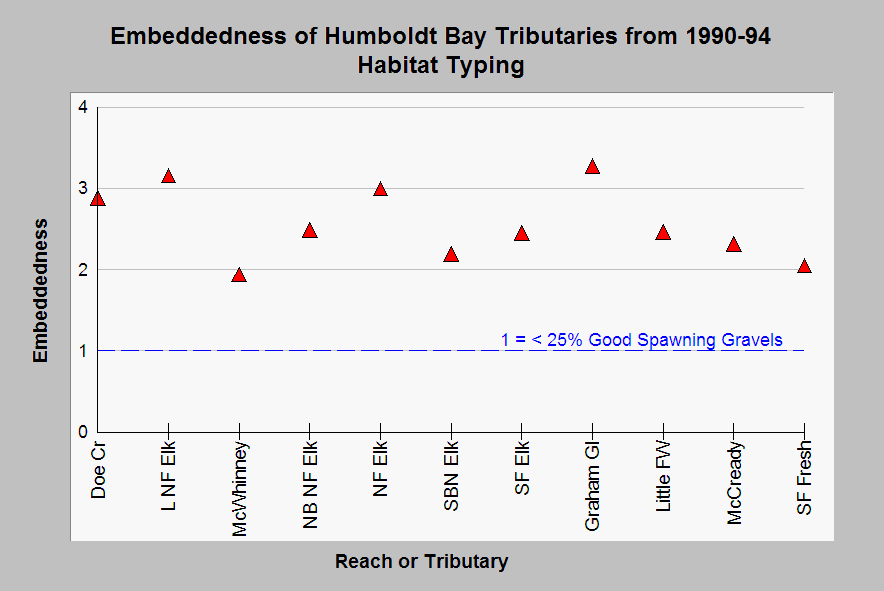
| Topic | Habitat: Scatter Plot Embeddedness All Humboldt Bay Tribs 1990-94 |
| Caption: This chart shows embeddedness scores summarized from habitat typing data collected by the California Department of Fish and Game from 1990 through 1994. Embeddedness of 1 equals less than 25% embedded, 2 = 25-50% embedded, 3 = 51-75%, and 4 = >75%. All sites had average embeddedness of above 50%. All streams are in Elk River except for Freshwater Creek tributaries Graham and McCready Gulch and Little and SF Freshwater. See Info Links for more information on use of habitat data in understanding aquatic health for salmonids. | |
 |
To learn more about this topic click Info Links .
To view additional information (data source, aquisition date etc.) about this page, click Metadata .
To view the table with the chart's data, click Chart Table web page.
To download the table with the chart's data, click hbhabsum.dbf (size 1,540 bytes)
To download the table with the chart's data as an Excel spreadsheet, click hbhabsum.dbf.xls (size 6,144 bytes) .
| www.krisweb.com |
