| Area | Mainstem |
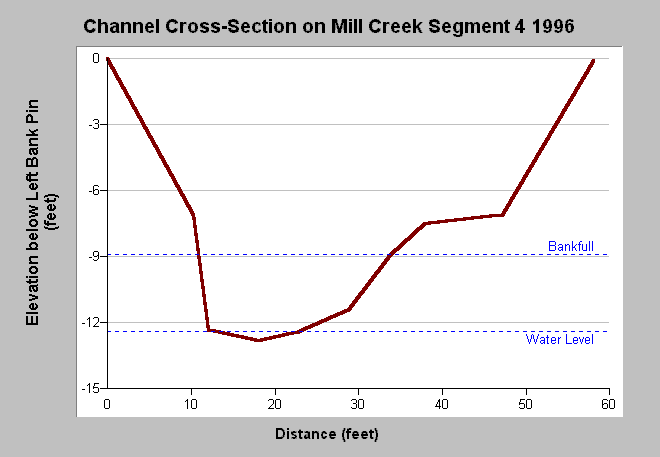
| Topic | Stream Channel: Cross-section survey Mill Creek Segment 4 1996 |
| Caption: The chart shows a cross-section survey of Mill Creek in August, 1996. Estimation of bankfull discharge at the top of the chart was made by the field crew. Cross-section data are valuable when sites are surveyed over time to monitor change. See Chart Table for explanation of data. See Info Links for more information on cross-section surveys. Data collected by Entrix et al. (1998) for the Navarro Watershed Restoration Plan. | |
 |
To learn more about this topic click Info Links .
To view additional information (data source, aquisition date etc.) about this page, click Metadata .
To view the table with the chart's data, click Chart Table web page.
To download the table with the chart's data, click trihey_xsect_mill4.dbf (size 754 bytes) .
To view the table with the chart's source data, click Source Table web page.
To download the table with the chart's source data, click trihey_xsect_nav.dbf (size 7,734 bytes)
| www.krisweb.com |
