Bibliography Background About KRIS
Water Temperature Patterns from 1956 to 1990's Suggest Increased Water Temperature
Comparison between historical water temperature data from Bryant (1956) for the lower Sheepscot River at Alna, and recent data suggest that water temperatures have increased between the mid-1950s and the present, although this relationship needs further study because only one year's data was available in the earlier period.
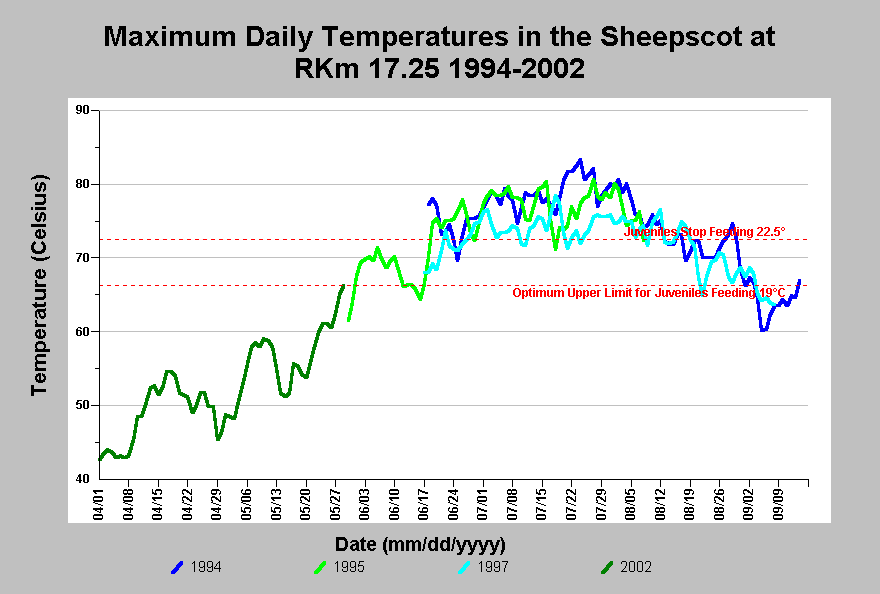 This chart shows maximum daily temperatures the Sheepscot River at Whitefield (river kilometer 17.25) in 1994, 1995, 1996, and 2002. Summertime maximum temperatures exceed 72.5° F, the maximum temperature at which juvenile Atlantic salmon feed, in nearly every day from mid-June through mid-August in 1994-1997. Due to high temperatures, it is likely that this site does not provide suitable rearing habitat for juvenile Atlantic salmon during the summer months. Data are from the ASC temperature database.
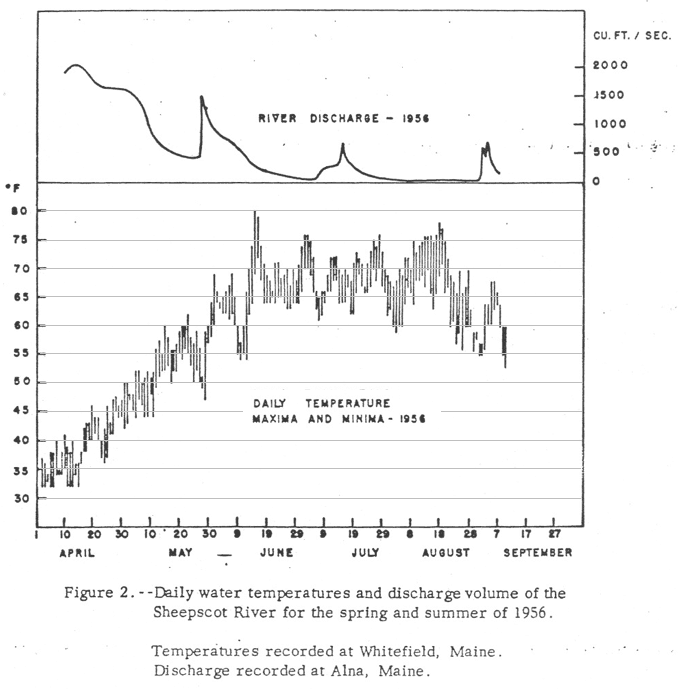 This chart shows the daily minimum and maximum temperatures in the Sheepscot River at Whitefield and streamflow in the Sheepscot at Alna in the summer and fall of 1956. Water temperatures were recorded on a Taylor chart recorder thermograph. The chart was extracted from Bryant (1956) and horizontal gridlines were added. Maximum daily temperatures exceeded 72.5°F on some summer days, but temperatures were noticeable cooler in 1956 than they were in 1994, 1995, and 1997. The difference was roughly 5 °F
The table compares flow and water temperature statistics between 1956, 1994, 1995, and 1997. The statistics show that the frequency of days in which the maximum temperature has exceeded 70°F has increased substantially. The reason for the temperature increase could be a number of factors, including: annual variations in weather, global climate change, changes in riparian conditions, or changes in channel geometry. Summer streamflows in 1956 were intermediate between 1997 (high) and 1994 (low), yet both 1994 and 1997 were warmer than 1956, so streamflow does not appear to explain the difference in temperature. A comparison of air temperatures between 1956 and 1997 could indicate whether the difference in temperature was due to chance difference in weather, or due to long-term change riparian vegetation or channel geometry.
| Year |
Annual Max (°F) |
Days with data in period May 30 - September 10 |
Days over 80°F |
Days over 75°F |
Days over 70°F |
Mean June Flow (cfs) |
Mean July Flow (cfs) |
Mean August Flow (cfs) |
| 1956 |
80 |
104 |
1 (1%) |
13 (13%) |
44 (42%) |
129.37 | 78.45 |
25.32 |
| 1994 |
83.3 |
89 |
11 (12%) |
46 (52%) |
69 (78%) |
101.6 |
32.23 |
30.9 |
| 1995 |
80.7 |
71 |
3 (4%) |
41 (58%) |
55 (77%) |
140.5 |
32.58 |
18.72 |
| 1997 |
78.4 |
84 |
0 (0%) |
15 (18%) |
63 (75%) |
155.67 |
82.81 |
24.26 |