Bibliography Background About KRIS
Hypothesis 5: Water quality is impeding recovery of Atlantic salmon in some reaches of the Sheepscot River.
Note: this hypothesis page examines the strength of the evidence to support the hypothesis that a "water quality complex" is impeding recovery of Atlantic salmon in the Sheepscot River. The aspect of water quality examined here is the interplay between nutrients, flow, algae, aquatic plants and dissolved oxygen. Water temperature, though mentioned in this discussion, is dealt with a separate Temperature hypothesis. Chemical pollutants such as pesticides are not addressed in any of these hypotheses.
Literature Foundation
Discussions below are based in part on information found in the KRIS Sheepscot water quality Background Pages, which include: Water Quality Standards, pH, Dissolved Oxygen, Bacteria, Nutrients, and Chemical Pollutants. Readers should consult those pages for additional details, but a summary of the most relevant information is presented again here.
Nutrients, algae, and aquatic plants
The most important nutrients for algae and aquatic plants are nitrogen and phosphorus, which each have several chemical forms. Nutrients are typically not directly stressful to fish, but they can cause algae blooms and excessive growth of aquatic plants, which negatively affect water quality by altering pH and dissolved oxygen levels, which it turn can negatively impact fish such as Atlantic salmon.
Dissolved oxygen
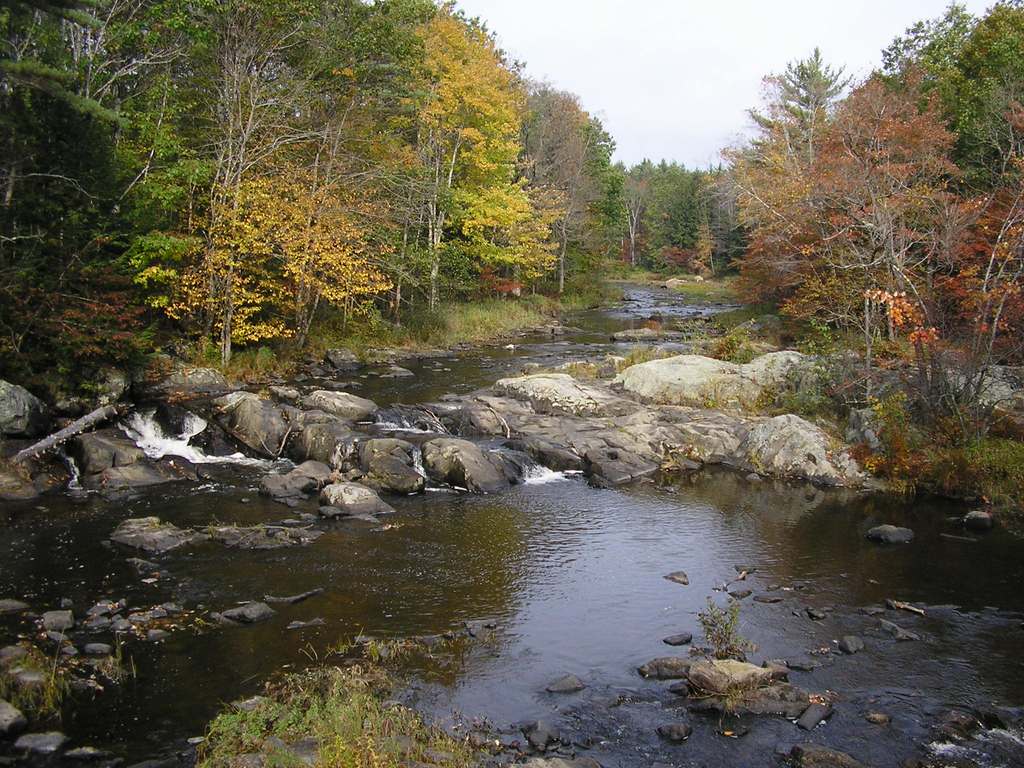 To thrive, Atlantic salmon require high levels of dissolved oxygen in the waters they reside in. Oxygen is added to water from the air by diffusion across the air-water interface, especially in riffles. In nutrient-rich water with algae blooms or large amounts of aquatic plants, dissolved oxygen drops at night due to respiration of algae/plants, while values during the day may sometimes be supersaturated due to photosynthesis. In a report to the Maine Atlantic Salmon Task Force, Dill et al. (2002) noted that summer dissolved oxygen (D.O.) "below 6 mg/L are not suitable for salmonids". The Maine DEP requires levels of 7 ppm and 75% saturation in all except Class C waters, which do not occur in DPS rivers. Photo: West Branch Sheepscot River at Howe Road (just upstream of mainstem confluence).
pH
During the daylight hours when aquatic plants and algae are growing, they remove carbon dioxide from the water column faster than it can be replenished from the air above, which raises pH levels. At night, growth slows and pH levels recover to equilibrium. The result of this process can be a substantial diurnal fluctuation in pH, with the highest pH occurring in the late afternoon and lowest pH values occurring at night. One concern about elevated pH is that, in combination with elevated water temperature, it may trigger a shift in available nitrogen from the ammonium ion to dissolved ammonia (Goldman and Horne, 1983), also know as un-ionized ammonia, which is lethal to fish life at concentrations as low as 0.025 mg/L (U.S. EPA, 1986). Low pH can also be a problem for Atlantic salmon, but this is not thought to be a concern in the Sheepscot River.
Sheepscot Literature and Data
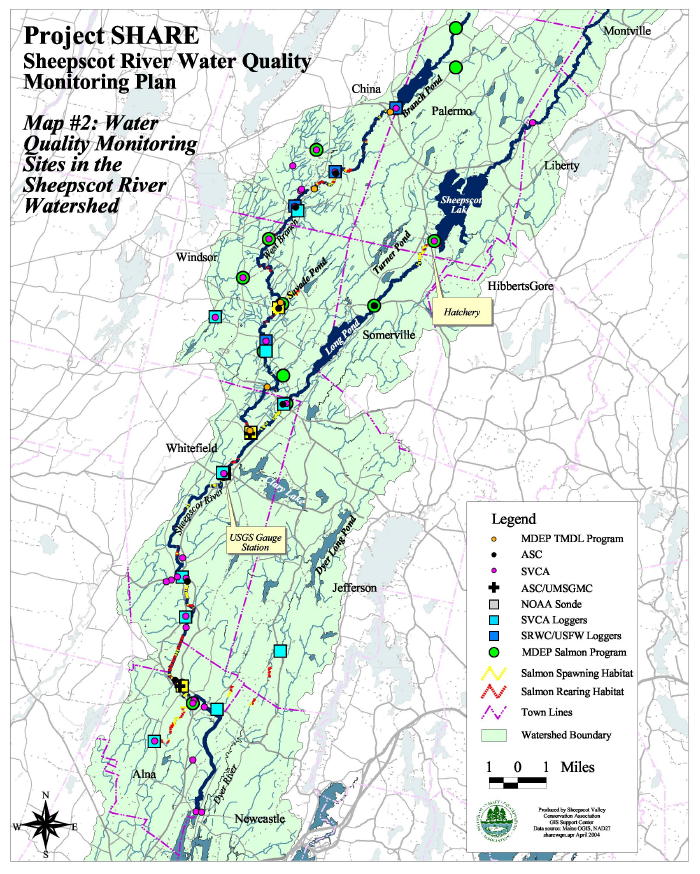
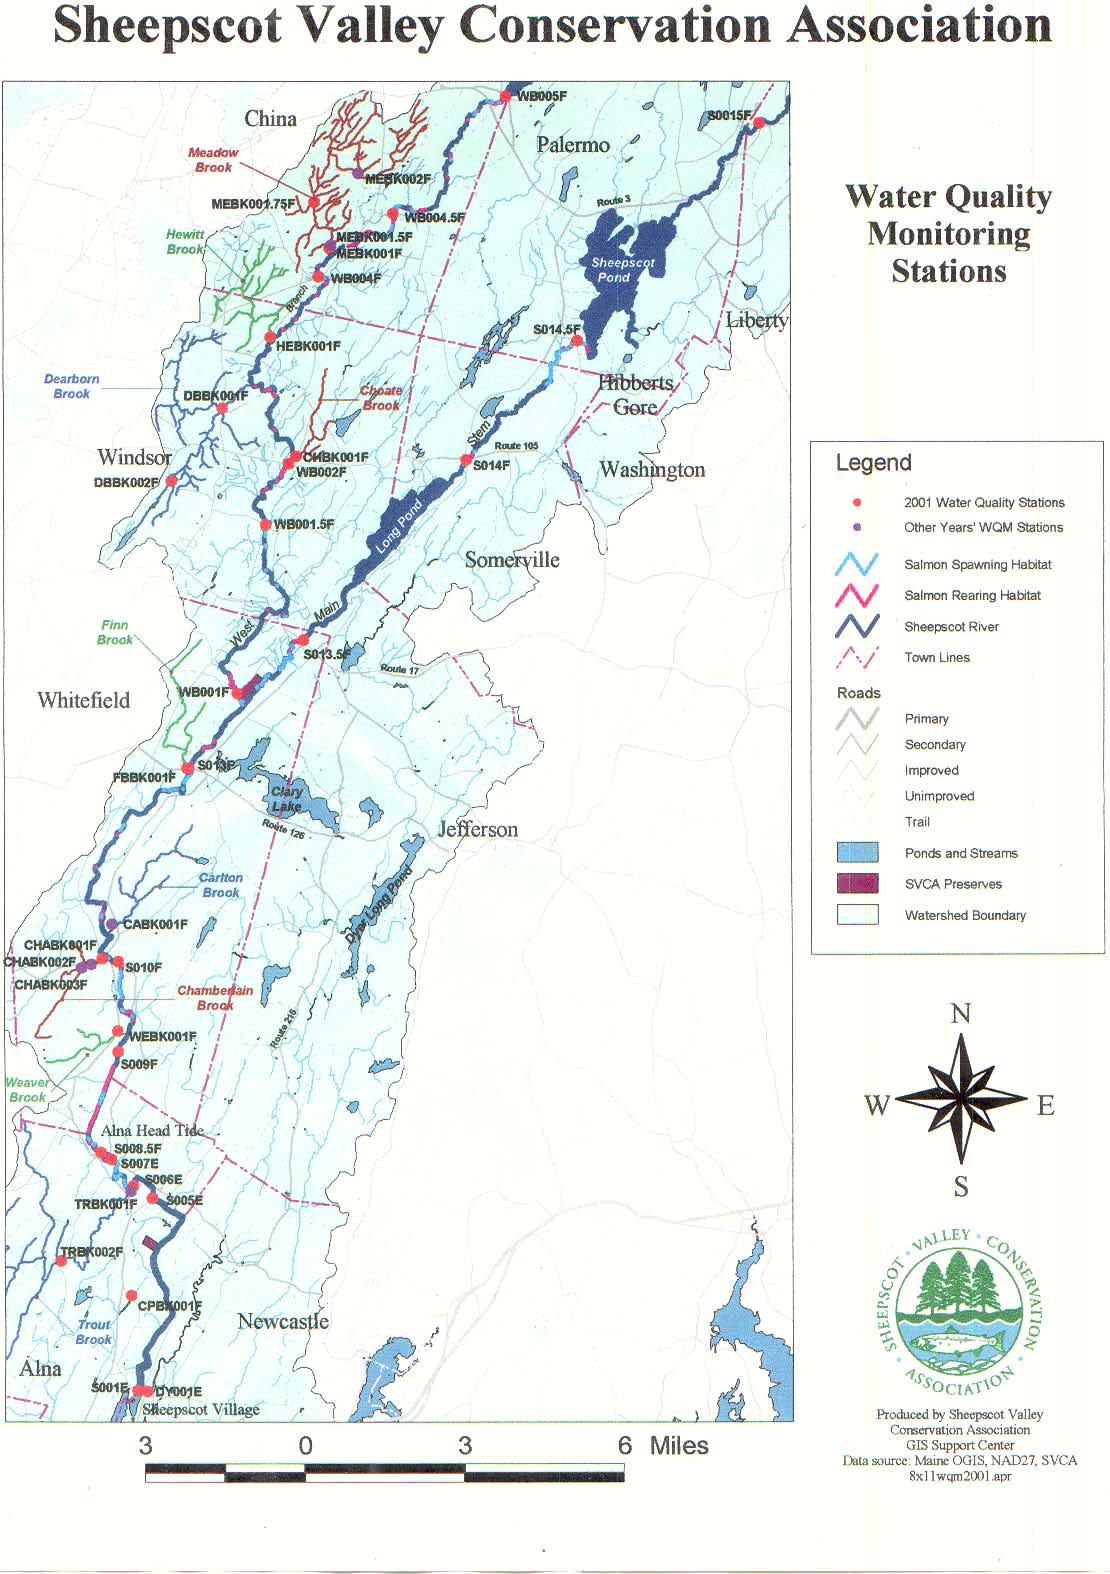
Water quality is widely recognized as being a problem in some reaches of the Sheepscot River. The Sheepscot is listed as impaired for dissolved oxygen (D.O.) and bacteria in several reaches (MDEP, 2001). A substantial amount of water quality data has been collected in the Sheepscot River watershed (see map). Many entities are involved in water quality monitoring, including the Sheepscot Valley Conservation Association (Pugh, 2002; Abello, 2002; Gambrel, 2003), Maine Department of Environmental Protection (Whiting, 2001a; ; 2001b; 2002), Maine Volunteer Lake Monitoring Program (Williams, 2002; 2003), Maine Atlantic Salmon Commission, NOAA Fisheries, and US Geological Survey. To better coordinate monitoring efforts, a strategic plan for water quality monitoring was recently developed (Arter, 2004).
While nutrient, dissolved oxygen, and pH are interlinked together, for the sake of organization they will be discussed here in separate sections.
Nutrients
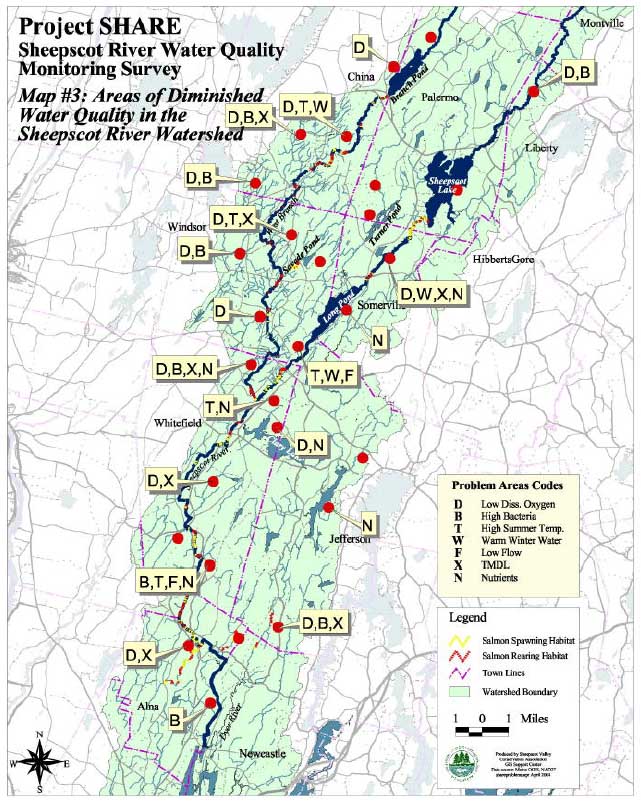
Of all DPS rivers, nutrients are recognized as a threat to Atlantic salmon survival only in the Sheepscot River (Dill et al., 2002). Nutrient sampling in the Sheepscot River has been conducted by the Maine DEP and the Maine Volunteer Lake Monitoring Project. Arter (2004) states that high nutrient levels have been observed at (also see map of water quality problem sites):
- Dyer Long Pond (on the Dyer River)
- Long Pond (on the mainstem Sheepscot above the confluence with the West Branch Sheepscot)
- Clary Lake (which enters the mainstem Sheepscot several miles below the confluence with the West Branch)
- Mainstem Sheepscot River at the USGS gage (several miles below confluence with West Branch Sheepscot, near route 126)
- Mainstem Sheepscot River at Long Rips (several miles upstream of Head Tide)
- Mainstem Sheepscot River at Head Tide
- West Branch at Howe Rd (just upstream of the confluence with the mainstem Sheepscot)
Non-point source pollution is a recognized problem in the Sheepscot River watershed, and is likely the cause of the high nutrient levels that have been observed (Arter, 2004). The following two charts support the conclusion that nutrients in the Sheepscot are caused by non point-source pollution, as nutrient concentrations increase during periods of increased runoff.
 This chart shows nitrate levels at five Sheepscot River watershed sites during six sampling dates in summer/fall 1999, with Sheepscot stream flow at the USGS gage overlaid as a thick blue line. On September 11 the season's first rainstorm increased streamflow to 179 cubic feet per second (cfs) from 32 cfs a day earlier. At the same time, nitrate levels rose dramatically at all sites except the mainstem Sheepscot at Route 17 (above the confluence with the West Branch). The rise in nitrate levels may have been caused by non-point source runoff. By September 30, streamflow had diminished and nitrate levels had decreased back to near baseflow levels. Data were collected as part of the Maine Department of Environmental Quality's baseflow water quality sampling.
 This chart from the same dataset as above indicates that total phosphorus shows a similar pattern to nitrate, increasing dramatically with the 1999 seasons's first rainstorm, and then subsiding as the river dropped again. According to Arter (2004), sites with phosphorus levels over 0.02 mg/L may have periphyton blooms and rivers with over 0.05 are often "negatively impacted." All sites shown in the chart had phosphorus levels of 0.02 or higher on at least one sample prior to the storm event, and most sites had phosphorus levels far higher than 0.02 during and after the storm event.
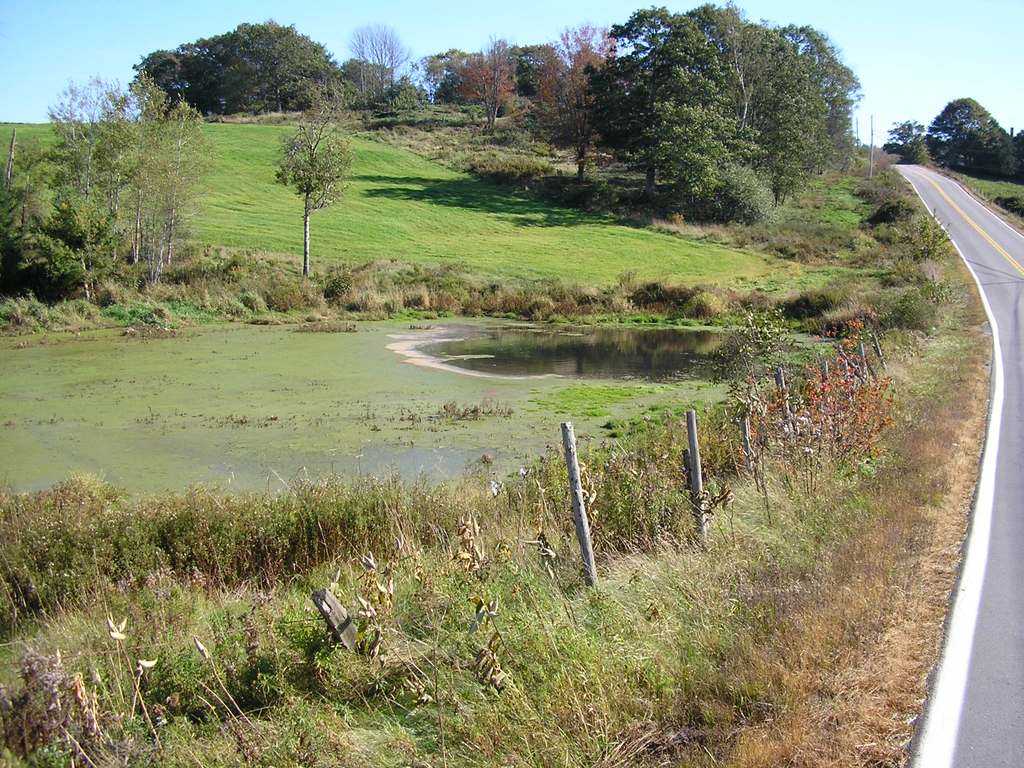
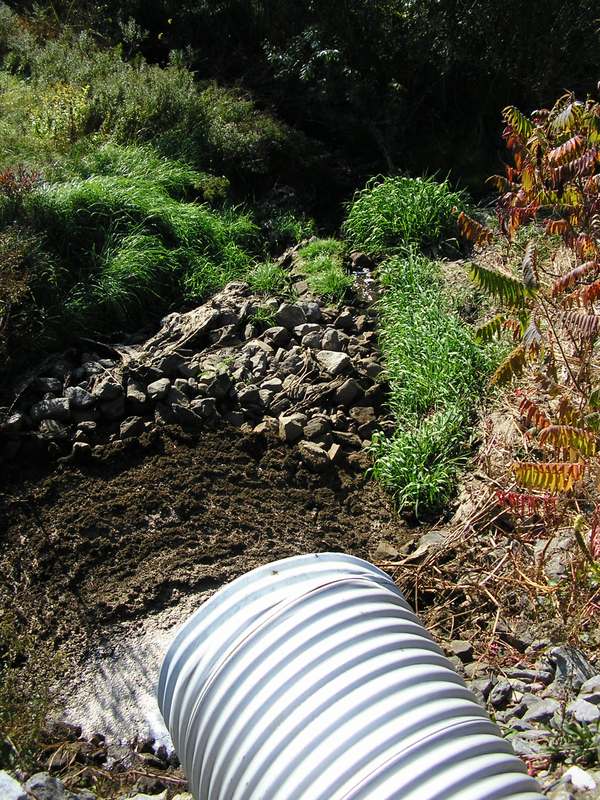 The photograph at left shows the view looking south along Highway 194 in the Dyer River sub-basin, east of where the highway crosses over the Dyer River. At the left side of the picture is a nutrient-rich pond mostly covered with thick mats of algae and other plants. The pond drains under the road through a culvert whose outlet is shown in the picture at right, and eventually flows into the Dyer River. Photographs by Eli Asarian, 10/8/2004
.
Dissolved oxygen
Among the DPS rivers, only the Sheepscot River has a significant dissolved oxygen (D.O.) problem (Arter, 2004; Dill et al., 2002). Maine DEP (2001) determined D.O. at seven sites to be so impaired they have been added to the Total Maximum Daily Load list, which recommends them for study and ultimate remediation (Arter, 2004):
| SEGMENT NAME |
SEGMENT SIZE (MI) |
SEGMENT CLASS |
MONITORED DATE |
IMPAIRED USE |
CAUSE(S) |
POTENTIAL SOURCE(S |
| West Branch below Halls Corner |
4.0 | Class AA | 2000 | Aquatic life Recreation |
Dissolved oxygen; Bacteria |
Agric NPS |
| MS Sheepscot below Sheepscot Pond |
4.0 | Class B | 2000 | Aquatic life |
Dissolved Oxygen |
Aquaculture PS |
| Dyer River below Rt 215 |
5.0 | Class B | 2000 | Aquatic life Recreation | Dissolved oxygen; Bacteria |
Agric NPs |
| Trout Brook (Alna) |
2.3 | Class A | 2000 | Aquatic life | Dissolved Oxygen |
NPs (unspecified) |
| Meadow Brook (China) |
5.0 | Class B | 2000 | Aquatic life | Dissolved Oxygen |
NPs (unspecified) |
| Carlton Brook (Whitefield) | 2.8 | Class B | 2000 | Aquatic life | Dissolved Oxygen |
NPs (unspecified) |
| Choate Brook (Windsor) |
1.3 | Class A | 2000 | Aquatic life | Dissolved Oxygen |
NPs (unspecified) |
 This chart contains summary statistical data of all dissolved oxygen data measurements taken at SVCA sample sites between 1994 and 2003. The median of the data measurements are represented by the notches, the 10th and 90th percentiles are represented by the ends of the boxes, and the 5th and 95th percentile are represented by the whiskers. Most data measurements were taken in the A.M. when DO levels tend to be lower due to the nighttime respiration of algae. The reference line shown at 7.0 mg/L is the lower limit where dissolved oxygen concentration begins to be stressful to salmon (MDEP, 2001). Median DO levels are below 7.0 mg/L at many sites. The 90th percentile is below 7.0 mg/L at MEBK001-F. Click here for a map of sampling stations.
The lower Sheepscot basin has the most problem with D.O., which Dill et al. (2002) ascribed to the accumulation of nutrients from the entire watershed. Halsted (2003) found that the lowest flow periods tended to coincide with the lowest dissolved oxygen levels. The fluctuation of dissolved oxygen nocturnally and diurnally, coupled with high chlorophyll-a levels, suggest that algae blooms may be driving D.O. cycles (Arter, 2004). Dissolved oxygen drops at night due to respiration of algae, while values during the day may sometimes be supersaturated due to photosynthesis. Algae blooms, in turn are stimulated by nutrients and warm water conditions.
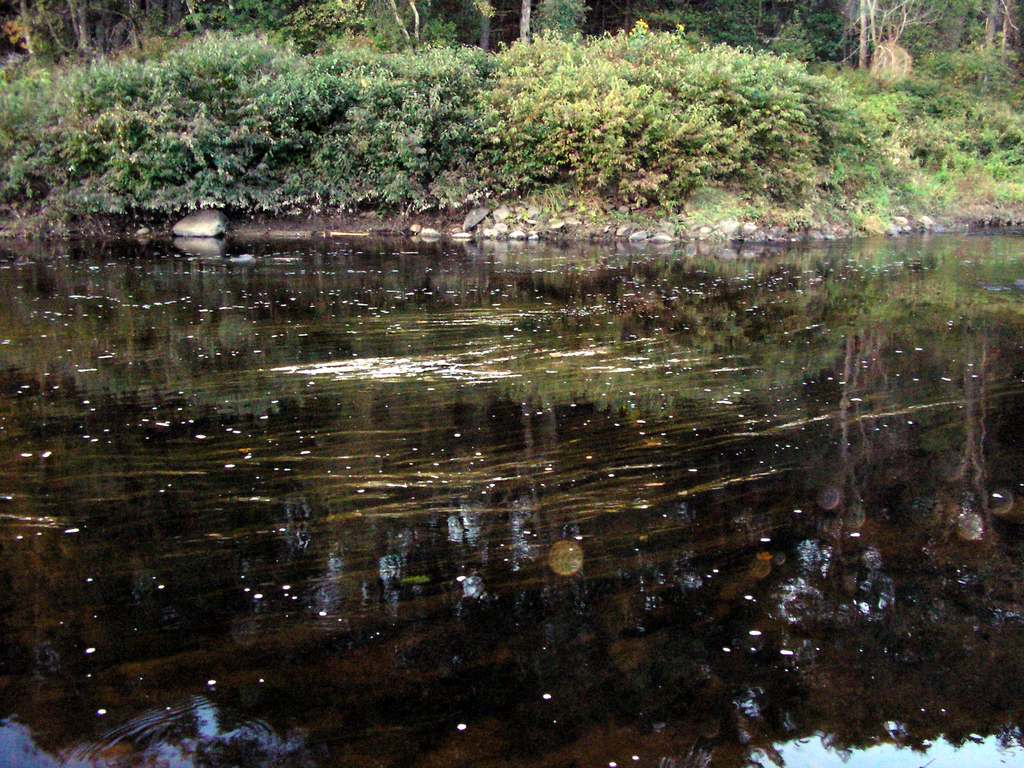 Substantial quantities of aquatic macrophytes are visible in the center of this picture, taken in the Sheepscot River a short distance upstream of Head Tide.
pH
As mentioned above in the Literature Foundation, photosynthetic activity of algae and aquatic plants can increase the pH of water. An examination of the pH data from the Sheepscot River above head tide clearly indicates substantial diurnal variation of pH, likely caused by photosynthetic activity. By themselves, the pH values observed at this site are likely not stressful to salmon, but in combination with high water temperatures, if ammonia is present, a significant percentage of it would be in its highly toxic unionized (dissolved) form and could therefore be harmful to fish. Un-ionized ammonia can be calculated from ammonia concentration, pH and temperature. For instance, at temperature of 25 C and pH 8, 5.38% of the ammonia would be unionized, and at pH 7.5, 1.77% of ammonia would be unionized (Goldman and Horne, 1983). There are no ammonia data available for anywhere in the Sheepscot watershed, so it is unknown if ammonia is present in high enough quantities to be a problem for salmon. If there are ammonia toxicity problems in the Sheepscot, the most likely time would be during summer low-flow conditions, because even though nutrient concentrations are higher during runoff events (see nutrient charts above) temperature and pH would likely be lower during high flows.
 This chart shows a summary of pH data in the Sheepscot River above Head Tide (river kilometer 10.35) from June 2001 to December 2003. pH values are higher and show increased diurnal variation in the summer compared to winter and spring. Data were collected with an automated probe by NOAA Fisheries, who provided a disclaimer with the data, and also corrected the data.
 The chart at right shows a summary of pH data in the Sheepscot River above Head Tide (river kilometer 10.35) from July, August, and September for the years 2001-2003, shown by time of day (hour). pH values show substantial diurnal fluctuations, with lowest values in the early morning hours, and highest values in the late afternoon. These diurnal fluctuations are likely due to photosynthetic activity. The median of the data measurements are represented by the notches, the 10th and 90th percentiles are represented by the ends of the boxes, and the 5th and 95th percentile are represented by the whiskers. Data were collected with an automated probe by NOAA Fisheries, who provided a disclaimer with the data, and also corrected the data.
 This chart shows the minimum, mean, and maximum pH (as measured in the field) at 8 Sheepscot River watershed sites for the 1999-2001 data. Data were collected in June-October as part of the Maine Department of Environmental Quality's baseflow water quality sampling, but do contain some stormflow data. The data did not contain the time of day that sampling occurred, which as shown in the chart above, is important.
While only tentative conclusions can be drawn from this limited pH dataset (each site was sampled only 4 to 10 times), the chart suggests that the range of pH values measured in the Sheepscot Head Tide is not out of the ordinary for the Sheepscot River watershed, and suggests that pH values may show even more variation at other sites in the watershed.
Relationship to Other Hypotheses (Potential Casual Mechanisms)
Hypothesis #2 : Warm water has less capacity to hold oxygen than cold water does. Low dissolved oxygen levels in portions of the Sheepscot River watershed are likely partially due to warm water conditions.
Hypothesis #3: Alterations of stream channels and simplification of aquatic habitat and riparian areas may have led to a widening of stream channels and loss of riparian vegetation, which would increase solar radiation, warming streams and increasing the amount of light available for growth of algae and aquatic plants. Loss of habitat complexity might also reduce the amount and quality of water quality refugia. Loss of riparian areas has also likely increased nutrient levels in the Sheepscot River by reducing the filter capacity of riparian buffers.
Hypothesis #4: Reservoirs created or expanded by dams can drown free-flowing river reaches, resulting in a loss of oxygenation. Lake and reservoirs can thermally stratify in the summer, with a layer of warm water on the surface (epilimnion) underlain by a cold bottom layer (hypolimnion). In nutrient-rich lakes and reservoirs, decomposition of organic matter removes oxygen from the hypolimnion, resulting in anoxia (low oxygen conditions). If water is released from the bottom of the reservoir, anoxic water from the hypolimnion can cause localized problems with dissolved oxygen.
Alternate Hypothesis: Water quality in the Sheepscot river is within its normal range of variability to which the Atlantic salmon population has adapted.
While water quality conditions in some reaches of the Sheepscot River are poor, and less than optimal in others, there are enough areas with adequate water quality for Atlantic salmon to survive; consequently, factors other than water quality are limiting Atlantic salmon production.
Monitoring Trends to Test the Hypotheses / Plugging Data Gaps
While there is a considerable amount of water quality data collected in the Sheepscot River watershed, the timing and frequency of samples does not provide a definitive information on the degree to which they limit Atlantic salmon production. Although specific parameters may not exceed lethal levels for Atlantic salmon, they may cause stress in juveniles and adults (McCullough, 1999). This stress can in turn cause a decrease growth, resistance to disease, and ability to compete and thereby increase mortality indirectly. The following studies are needed to determine whether conditions are sometimes lethal to Atlantic salmon:
1) Collect dissolved oxygen samples in pre-dawn hours when algal respiration and BOD may cause the worst problems.
2) Install continous, automated water quality gauges where acute water quality problems are suspected.
3) Measure for ammonia in areas where there are coincident high nitrogen levels and elevated pH.
4) Use spatial data on fish distribution to discern whether there is an overlap in acutely stressful water quality conditions and presence of Atlantic salmon juveniles or adults.
Much of the currently available data consist of single measurements on perhaps a monthly basis. Automated probes would provide a more detailed view of how water quality changes on both a daily and season basis and provide tools for evaluation of the effectiveness of sediment remediation, riparian improvement, or other efforts carried out to abate non-point source pollution and/or recovery Atlantic salmon. Detailed analyses of the existing data compiled in the KRIS Sheepscot database could help to elucidate the relationships between Atlantic salmon and water quality. These datasets include nutrient, pH, dissolved oxygen, temperature, climate, flow, refugia locations, stocking, electrofishing, and smolt-trapping.
References
Abello, P. 2002. Sheepscot Valley Conservation Association (SVCA) Water Quality Monitoring Program 2002. SVCA. Alna, ME. 15 pp. [82kb]
Arter, B. S. 2004. Sheepscot River Water Quality Monitoring Strategic Plan: A guide for coordinated water quality monitoring efforts in an Atlantic salmon watershed in Maine. Prepared for the Project SHARE: Research and Management Committee. 84 pp. [975kb]
Dill, R., C. Fay, M. Gallagher, D. Kircheis, S. Mierzykowski, M. Whiting, and T. Haines. 2002, Water quality issues as potential limiting factors affecting juvenile Atlantic salmon life stages in Maine rivers. Report to Maine Atlantic Salmon Technical Advisory Committee by the Ad Hoc Committee on Water Quality. Atlantic Salmon Commission. Bangor, ME. 28 pp. [162kb]
Gambrel, S. C. 2003. Sheepscot Valley Conservation Association (SVCA) Water Quality Monitoring Program 2003. SVCA. Alna, ME. 15 pp. [81kb]
Goldman, C.R. And A.J. Horne. 1983. Limnology. McGraw-Hill, Inc. New York . 464 pp.
Maine Department of Environmental Protection. 2001. Water Classification Program.
Augusta, ME.
Pugh, L., 2002. Analysis summary of water quality monitoring data, 1994-2001. Sheepscot Valley Conservation Association. Alna, ME. 6 pp. [225kb]
US Environmental Protection Agency, 1986. Quality criteria for water 1986: EPA 440/5-86-001. Office of Water Regulations
and Standards, Washington D.C.
Whiting, M., 2001a. Year 2000 Progress Report for DEP Water Quality Monitoring Plan - Maine Atlantic salmon rivers. Maine DEP, Bangor Regional Office. Bangor, ME. 4 pp. [25kb]
Whiting, M., 2001b. Progress report: A summary of water quality monitoring results from Spring 2001, Maine Atlantic Salmon Rivers Project. Maine DEP, Bangor Regional Office. Bangor, ME. 6 pp. [775kb]**
Whiting, M., 2002. Maine Salmon rivers water quality monitoring progress report for 2002 field season. Maine DEP, Bangor Regional Office. Bangor, ME. 22 pp. [2.25Mb]**
Williams, S. 2002. Maine Volunteer Lake Monitoring Program Annual Report 2002. Maine Volunteer Lake Monitoring Program, Auburn, Maine. 52pp. [7 Mb] http://www.mainevolunteerlakemonitors.org/.
Williams, S. 2003. Maine Volunteer Lake Monitoring Program Annual Report 2002. Maine Volunteer Lake Monitoring Program, Auburn, Maine. 52 pp. [8 Mb] http://www.mainevolunteerlakemonitors.org/.