
|

|
| Background | Analysis | Bibliography | Maps | Home |
|
|
|
| Background | Analysis | Bibliography | Maps | Home |
KRIS Web Background Pages: Riparian Areas
![]()
The KRIS Noyo database contains canopy cover information from habitat typing surveys provided by CDFG and the Georgia Pacific Company which can also be used to gauge stream health (see Habitat Typing background page). Canopy is measured using an instrument called a densiometer. One problem with canopy information is that is does not indicate riparian over-story conditions which effect microclimate and large wood recruitment potential. To learn more about canopy measurement, see FSP bulletin.
The KRIS Noyo Map project contains forest stand data from the U.S. Forest Service Pacific Southwest Region Remote Sensing Lab (see Vegetation Information in KRIS ) and U.S. Geologic Survey (USGS) digital orthophotos, which can both be used to assess riparian health. The USFS vegetation is shown only in a buffer of 90 meters (297 feet) immediately adjacent to both sides of the stream and shows tree size at the one hectare scale. The 90 meter area was chosen to represent a zone of influence on streams from which large wood recruits and which helps control microclimate over the stream. The orthophoto quads have one meter resolution and allow determination of riparian zone width within ArcView. These quad-sized aerial photos are not available for all quadrangles in the Noyo Basin.
Keithley (1999) assessed riparian conditions in the Noyo River basin with regard to restoration potential, specifically large wood recruitment. He found that recruitment potential for large wood was low in many Noyo River tributaries because of timber harvests and that only 23% of riparian zones in low gradient reaches favored by salmon had trees over 24 inches in diameter.
 |
The USFS vegetation coverage from the KRIS Noyo Map project is shown at left as a 90 meter riparian influence zone for Marble Gulch, a North Fork Noyo River tributary, with a USGS Topo map as the back ground layer. Upper tributary riparian areas are characterized as mostly early seral with Saplings (1-4.9" diameter) and Non-Forest. On reaches of main upper Marble Gulch and in patches downstream toward the confluence with the North Fork Noyo River, Medium/Large trees (20-29.9" diameter) are the dominant type. |
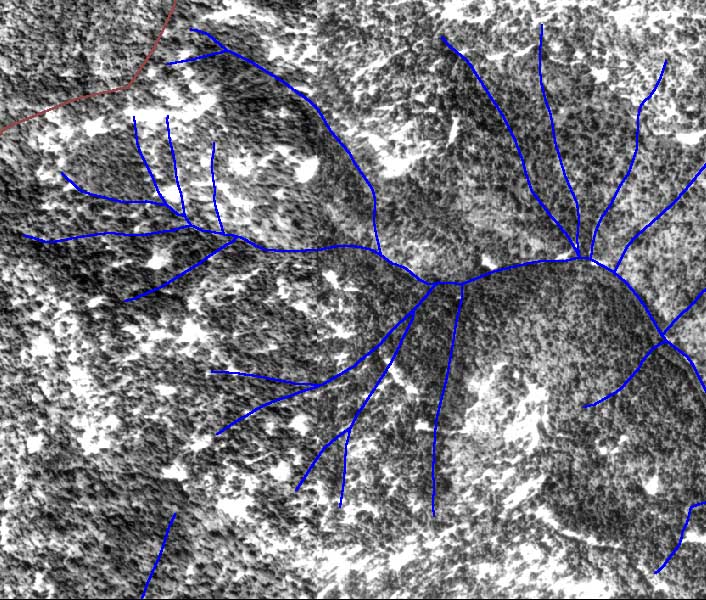 |
The U.S. Geologic Survey provided digital orthophotoquads for the KRIS Noyo project for the Burbeck and Northspur Quadrangles. The western headwaters of Marble Gulch are shown at left with 1:24,000 hydrography, also from USGS. The image confirms early seral conditions in upper reaches of Marble Gulch. |
|
The image at left shows the USFS vegetation coverage, screened for a 90 meter riparian zone of influence, against a USGS orthophoto backdrop for the North Fork Noyo River above Hayworth Creek. Most of the riparian community is in early seral conditions. See Hypothesis #5 to find out about the potential influence on stream temperature. |
The USGS 1:24000 hydrography appears to place streams somewhat off from the actual stream channel location when compared with orthophotoquads. When the USFS vegetation coverage is queried to show 90 meters on each side of the USGS stream coverage, the riparian zone may not align with the stream. However, because the USFS vegetation coverage is accurate only at the one hectare scale, the shift in the streamline does not appear significant in changing the characterization of riparian zones. On Noyo basin industrial timberland, riparian buffers are often less than 100 meters wide, including both sides of the stream. Large trees left in this narrow band do not show at the one hectare scale because they are subdominant to early seral stages in adjacent uplands. Small scale aerial photos or site visits should be used if more precise, site specific conditions are to be accurately described.
![]()
References
Keithley, C. 1999.
Evaluating Stream and Watershed Conditions in Northern California. Prepared
for the California Department of Forestry, Fire and Resource Assessment Program.
Sacramento, CA. 17 pp.
Schwind, B. 1999. USFS Thematic Mapper Landsat Vegetation Coverage Background Information. USDA Forest Service. Pacific Southwest Region Remote Sensing Lab. Sacramento, CA.
Warbington, R., B. Schwind, C. Curlis and S. Daniel. 1998. Creating a Consistent and Standardized Vegetation Database for Northwest Forest Plan Monitoring in California. USDA Forest Service. Pacific Southwest Region Remote Sensing Lab. Sacramento, CA.
![]()
| www.krisweb.com |