 |
 |
| Background | Hypotheses | Bibliography | Maps | Home |
|
|
| Background | Hypotheses | Bibliography | Maps | Home |
KRIS Ten Mile Map Project: Land Cover View
![]()
The Land Cover View in the KRIS Ten Mile Map project provides a wealth of spatial data for watershed assessment. Vegetation stand conditions, change scene detection between 1994 and 1998 Landsat images, road locations and period of construction and ownership are just some of the themes found in this View. For establishing location and a sense of topography, Calwater planning watershed boundaries, a USGS topographic map, a digital elevation map and a tiled aerial mosaic of the Ten Mile watershed from 1999 photos are provided. The vegetation themes, derived from a 1994 Landsat image by the USFS Spatial Analysis Lab in Sacramento, can be queried by tree size or by community type (see Vegetation Types). The California Department of Forestry (CDF), Fire and Resource Assessment Program (FRAP) provided the change scene detection, which compares a 1994 Landsat image with one captured in 1998 (Fisher, in press).
|
|
This image, from the KRIS Ten Mile Map project, shows USFS vegetation coverage derived from 1994 Landsat imagery for the entire Ten Mile River Basin. Much of the South Fork Ten Mile landscape is characterized as early seral stands with Non-Forest (grass/shrubs/bare soil) and Saplings (trees 2-4.9" diameter) due to recent logging. Large Non-Forest components in the east and west are natural due to grasslands and sand dunes, respectively. Much of the central portion of the watershed has substantial components of Small-Medium (12-19.9") and Medium/Large trees (20-29.9") interspersed with patches of Small Trees (5-11.9") indicating a more mature forest than in the South Fork. |
|
|
This image from the KRIS Ten Mile Map project shows changes in vegetation from 1994 to 1998 based on Landsat images from both periods. These data come from CDF FRAP (Fisher, in press) and reveal extensive logging during this period with more intensive cover removal showing as deeper oranges and reds. Vigorous re-growth in plantations shows as shades of green. |
 |
The image at left is from the EPA Land Cover project, which is included in the KRIS Ten Mile Map project. The sand dunes of the beach show as bare rock in the west, where pastureland is also strongly represented. The northeastern portion of the watershed shows as grasslands, shrubland and mixed forest due to earthflow terrain in this region. Patches of mixed forest and shrubland disbursed throughout the watershed reflect early seral conditions after timber harvest. |
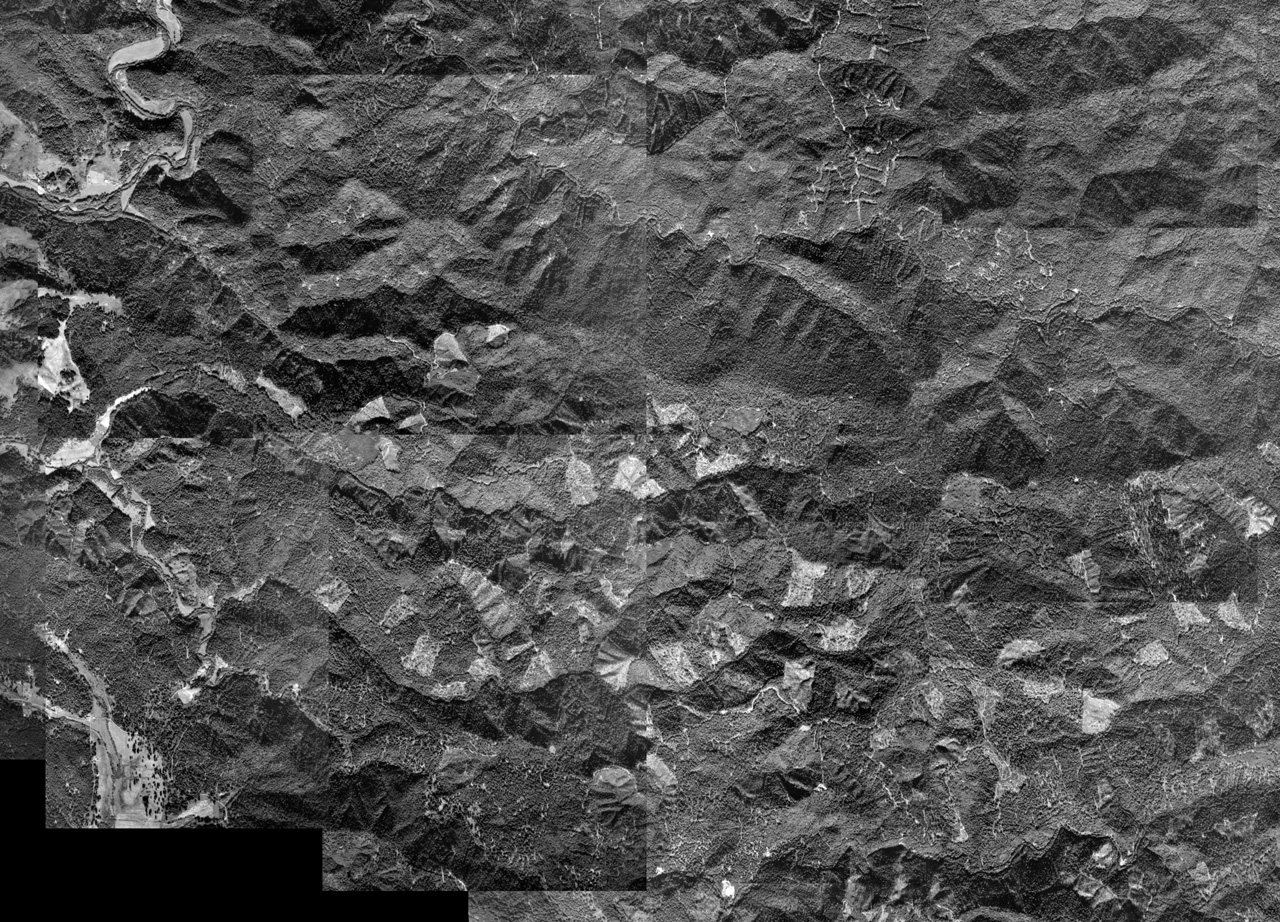 |
The image at left is from a tiled aerial mosaic of 1999 photos compiled by Matthews (2000). This theme is useful for getting a sense of what ground conditions are like for reference in watershed assessment. This image shows the South Fork Ten Mile basin with recent clear cuts showing prominently. |
 |
The map at left shows road construction by period as reconstructed by Matthews and Associates (2001) from aerial photos. The road network was significantly expanded between 1988 and 1999. The U.S. Geologic Survey 1:24,000 DRG roads are also displayed. Matthews mapped roads only in the Ten Mile basin proper while the area for the KRIS project extends to smaller basins to the north and south. |
 |
The image at left shows stream crossings and lengths of road within 30 meters of streams. Both these themes were developed by KRIS staff based on USGS 1:24,000 hydrography and roads coverages which under-estimate small streams and recently built roads. The yellow lines following major tributaries indicates that haul roads are located in riparian zones, just as railroads were before them. |
![]()
References
Matthews, Graham and Associates. 2000a. Sediment source analysis and preliminary sediment budget for the Ten Mile River, Mendocino County, CA. Prepared for Tetra Tech, Inc. VOLUME 1: Text, Tables, and Figures. Fairfax, VA. 143 pp.
Matthews, Graham and Associates. 2000b. Sediment source analysis and preliminary sediment budget for the Ten Mile River, Mendocino County, CA. Prepared for Tetra Tech, Inc. VOLUME 2: Appendices. Fairfax, VA. 59 pp.
Warbington, R., B. Schwind, C. Curlis and S. Daniel. 1998. Creating a Consistent and Standardized Vegetation Database for Northwest Forest Plan Monitoring in California. USDA Forest Service. Pacific Southwest Region Remote Sensing Lab. Sacramento, CA.
![]()
KRIS Ten Mile Map Views:
| www.krisweb.com |