Bibliography Background About KRIS
Maps for Humboldt Bay and KRIS Map Tools
The KRIS Humboldt Bay project takes advantage of a number of sources of high quality spatial data, often referred to as GIS or Geographic Information System data. Redwood Community Action Agency created many high quality map compositions in support of the Humboldt Bay Watershed Salmon and Steelhead Conservation Plan. The Institute for Fisheries Resources also assimilated data from many sources for the KRIS Humboldt Bay project. Examples are displayed below.
The latest advancement in KRIS on-line technology is a zoom and pan for Map Topics. The Humboldt Bay Turbidity Threshold Sampling Stations map shows the Humboldt Bay monitoring stations, USGS topographic maps, streams, and shaded relief. Each monitoring stations can be clicked to view information about the station and to link to further turbidity information. This tool allows users of KRIS on the Internet to look at spatial data at different scales with very quick refresh times. Annotations assist with understanding patterns in the data and watershed health. Users operating KRIS from their hard drives have an ArcView-equivalent spatial data display tool just by clicking on the Map tab.
 Humboldt Bay Geology
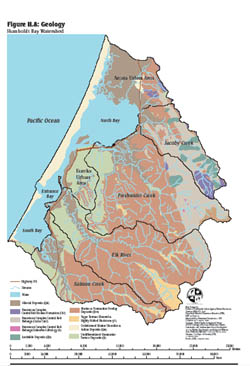
This geology map was produced by Georgia Trehey of RCAA for the Humboldt Bay Watershed Salmon and Steelhead Conservation Plan with U.S. Geologic Survey survey data. The rock types are all weakly consolidated sandstones or Franciscan Formation. The linear contact between units paralleling to the north is the Freshwater Creek is the Freshwater Fault.
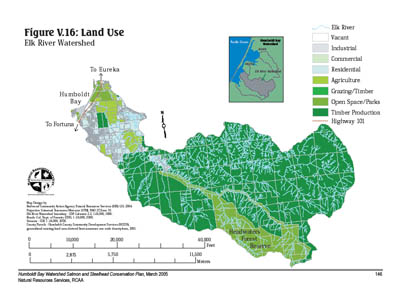
Elk River Land Use
This land use Map of Elk River shows the Headwaters Preserve, working timberlands and agricultural areas to the west. Composition by Michele Copas of Redwood Community Action Agency.
 Roads Crossing Streams
Legacy the Landscape assimilated road data for northwestern California from all available sources including the California Department of Forestry, the U.S. Geologic Survey, and the U.S. Forest Service.
Dr. Paul Trichilo used these data and USGS 1:24000 stream data to create the stream crossings shown on this map.
 Riparian Conditions
This map image shows 1999 Landsat-derived vegetation in riparian zones (defined as 100 meters in each direction from the stream center line). The original data are from the U.S. Forest Service Spatial Analysis Lab in Sacramento in combination with the California Department of Forestry FRAP program. The color classification and query for the 100 m buffer is by Dr. Paul Trichilo of the Institute for Fisheries Resources KRIS project.
See Veg Type Background page for more information or use the dynamic map functions of KRIS on your desk (Map Tab) top or on-line.
 Changes in Vegetation
The U.S. Forest Service Spatial Analysis Lab in Sacramento in combination with the California Department of Forestry FRAP program has assessed landscape vegetation change for various areas in California (Lavien et al., 2002).
This map shows the changes in landscape vegetation derived by comparing Landsat imagery from 1994 and 1998. Dr. Paul Trichilo of IFR assimilated the data and provides useful legends.. Red-orange patches indicate a 40-70% or greater decrease in canopy, while light blue colors show growth in areas harvested in the recent past. See Veg Type Background page for more information.